In this blog, you will learn how to create and view custom ARC Relationship Graphs in Salesforce Financial Services Cloud (FSC) using the new Graph Designer. Relationship Graphs in the Actionable Relationship Center (ARC) provide a powerful way for advisors and bankers to visualize client relationships, household structures, and account connections in a clear, interactive format. With the Graph Designer, you can customize card names, display fields, and actions to make navigation seamless and ensure advisors have the right context during client interactions.
You’ll also discover how to build more than one graph per object, tailor graphs to different page layouts, and show customer relationship data based on user profiles. This step-by-step guide will walk you through building a custom graph—from selecting templates to configuring properties, nodes, and relationships—so you can design a visualization that improves customer engagement and strengthens relationship management.
Meet the new Graph Designer!<br/>
Learn how to build custom ARC Relationship Graphs with objects that are important to your users
- Add the ARC Relationship Graph component to record pages to let your users view and interact with records.
- Customize card names, display fields, and object and record actions so your users can easily navigate and engage with records during customer interactions.
- Create more than one relationship graph per object to show relevant customer information to your users.
- Add unique graphs to page layouts so users see customer relationship data based on their profile.
- In a production org or sandbox a Guided Setup is available for you!
Let’s build our own ARC graph:
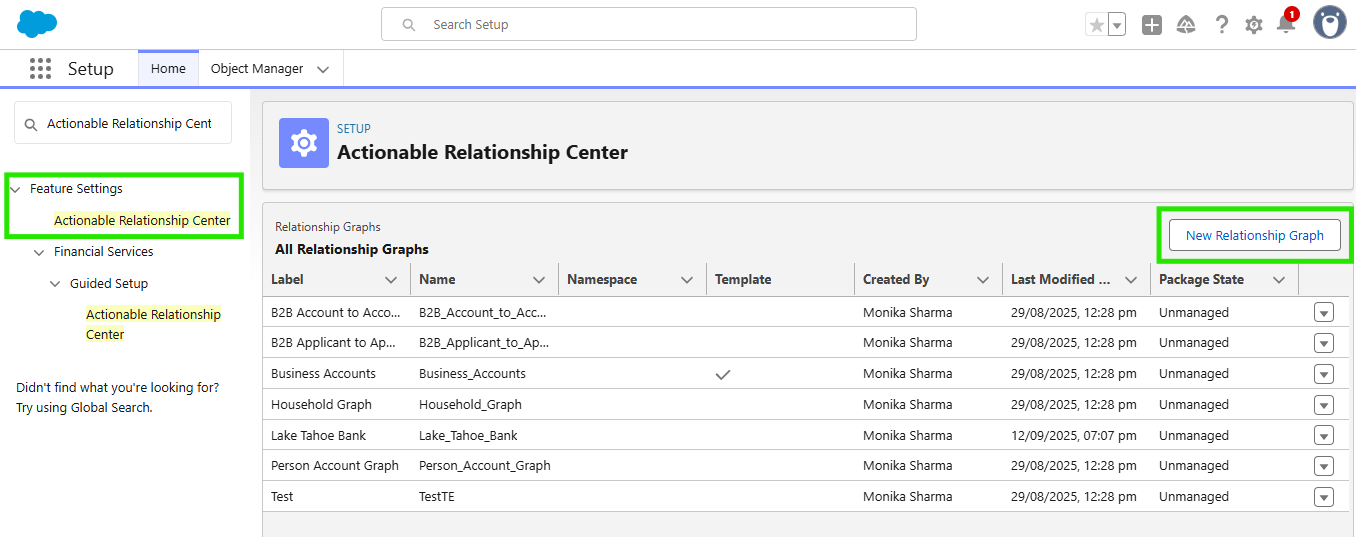
- Click Setup > Quick Find > Actionable Relationship Center
- Check out the Guided Setup under Financial Services real quick
- Under Feature Settings click > Actionable Relationship Center > click New Relationship Graph.
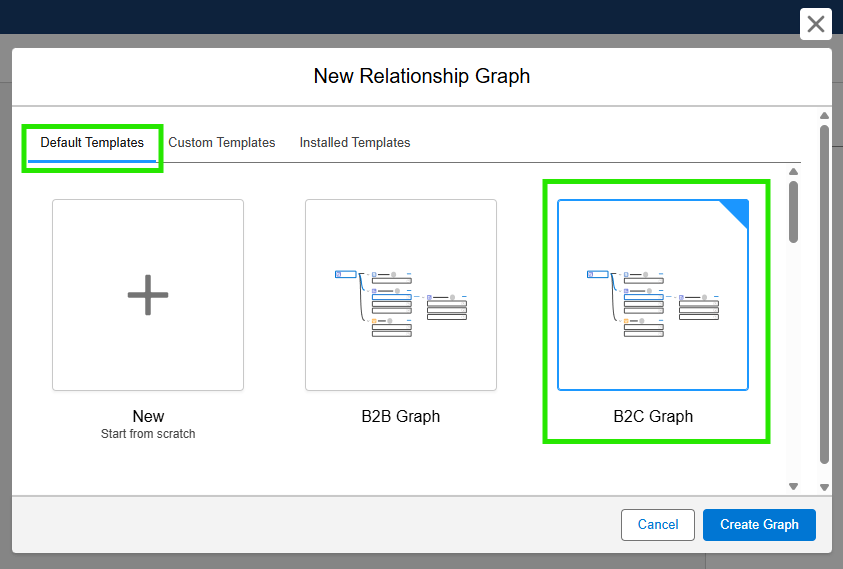
- Under Default Templates select B2C Graph and click Create Graph.
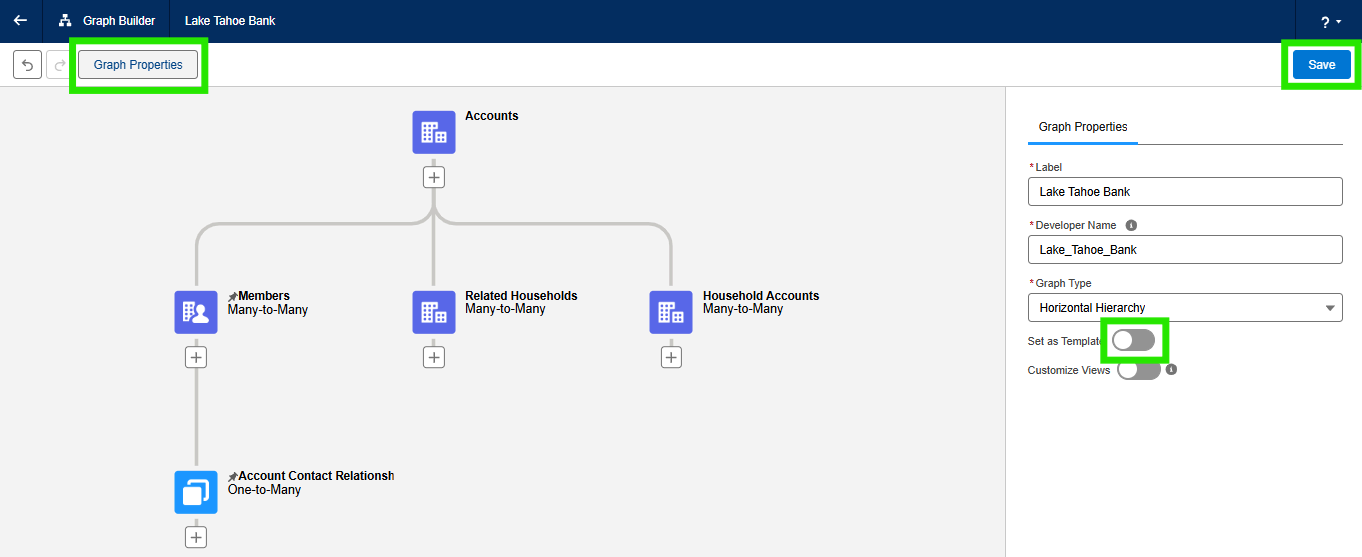
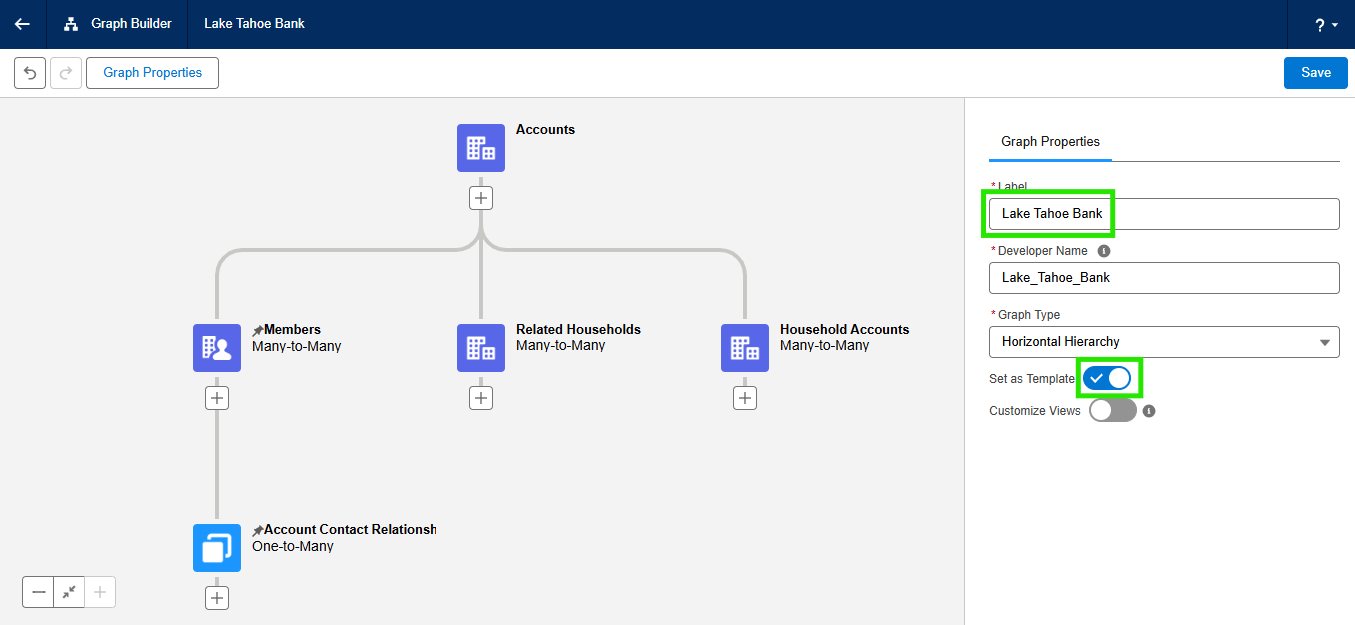
- Configure the Graph Properties: Enter a label Lake Tahoe Bank (unique developer name will populate)
- To create a custom template select Set as Template
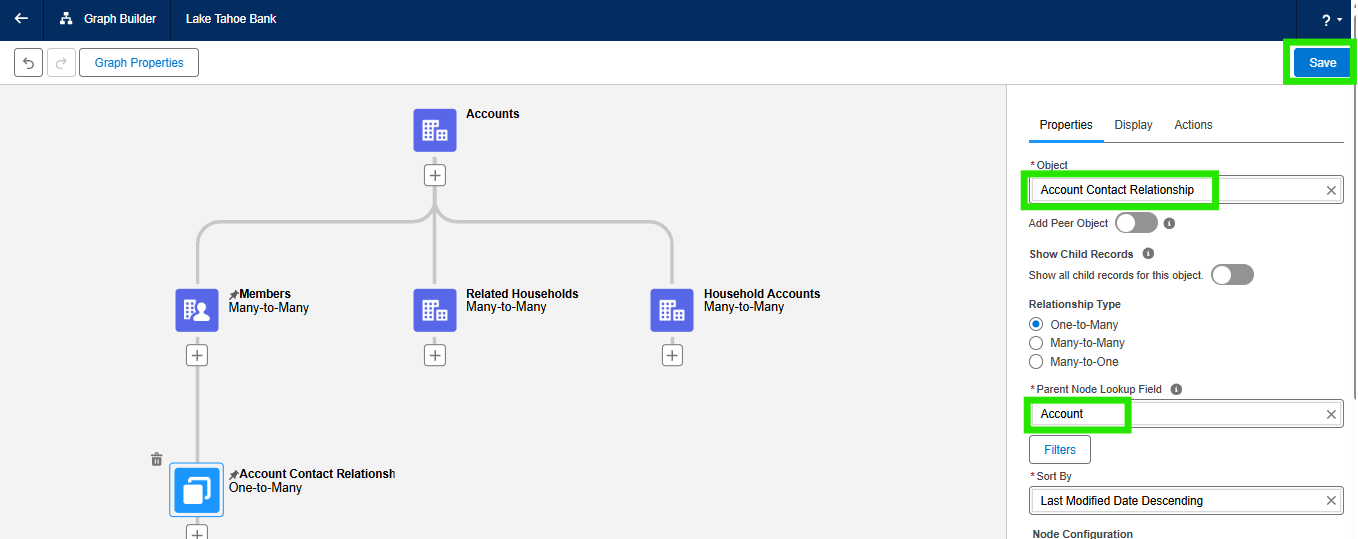
- Set the Graph Display Type to Horizontal Hierarchy. (Horizontal Hierarchy - new nodes are shown left to right. Vertical Hierarchy - new nodes are shown top to bottom.) and click Save.
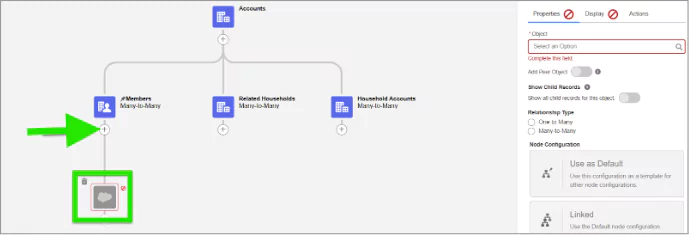
- Hover over all the little buttons to learn features & options.
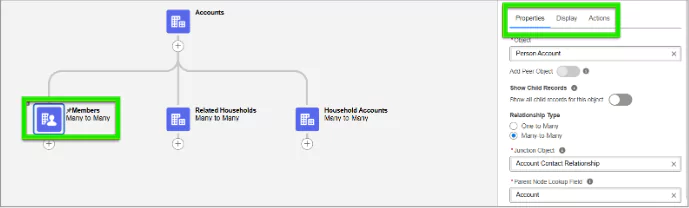
- Click on the Member node and review the Properties, Display and Action tabs.